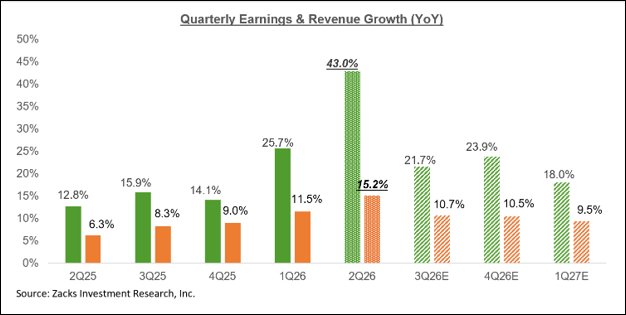
Through Friday, August 7, 444 members of the S&P 500 had reported second-quarter results, representing 88.8% of the index’s membership. Based on the earnings methodology used for this report, total earnings for those companies increased 42.2% from the prior-year period on revenue growth of 14.8%. Approximately 82.7% reported earnings per share above consensus estimates, while 76.4% exceeded revenue estimates.
Reporting companies have discussed order activity, profit margins and their expectations for full-year demand. Analysts have continued updating their financial models as new information becomes available, resulting in increased earnings estimates for the third quarter and some later periods. This pattern of upward revisions has developed over approximately the past year, although estimates remain subject to change.
Earlier upward revisions were concentrated largely in Technology and, more recently, Energy following supply disruptions in the Middle East. For 3Q2026, revisions have expanded to include Transportation, Finance, Aerospace, Industrials, Utilities and Construction, in addition to Technology and Energy. The direction and scale of revisions vary by company and industry.
The chart below gives you a big-picture view of overall earnings. It highlights current Q2 expectations right alongside actual results from the past four quarters and forecasts for the next four (including 2Q2026).
About This Page
Stockmark101.com is a free educational site focused on explaining how stocks and markets work. Company write-ups reflect general market commentary and publicly available information and are used to illustrate business fundamentals and market behavior — not to provide personalized investment advice.
The Magnificent 7 Earnings Update
Six Magnificent 7 companies—Alphabet, Amazon, Apple, Meta, Microsoft and Tesla—had reported second-quarter results as of August 7. Nvidia was scheduled to report on August 26.
Combining the results of the six reporting companies with the consensus estimate for Nvidia, the group’s earnings were projected to increase 85.5% from the prior-year period on revenue growth of 27.5%. Because Nvidia had not yet reported, these figures represented a blend of actual results and estimates rather than completed results for the entire group.
Cloud-computing results are one measure analysts use to evaluate the commercial activity associated with spending on artificial intelligence. Amazon, Microsoft and Alphabet each reported cloud revenue growth during the quarter, with Alphabet recording the highest growth rate among the three.
Based on current estimates, the Magnificent 7 were projected to generate approximately 28.9% of total S&P 500 earnings in 2026, compared with 16.4% in 2020. The group also represented approximately 33.7% of the index’s market capitalization.
Using the sector classifications applied in this report, Technology accounted for an estimated 41.6% of S&P 500 earnings and 46.3% of its market capitalization. Total 2026 S&P 500 earnings were projected to increase 27.1%; excluding the Technology sector’s contribution, the estimated increase was 14.6%. These figures illustrate the sector’s influence on index-level results but do not predict future market performance.
Mark Notes
Corporate earnings and expectations about future profitability are among the many factors that can influence stock prices. Companies generally report results every quarter, and analysts publish estimates before those reports. The collection of individual analyst estimates is commonly referred to as the consensus estimate.
Investors often compare a company’s reported earnings and revenue with these consensus figures. Results above or below expectations can contribute to price fluctuations, but a stock’s reaction can also reflect valuation, management commentary, forward guidance and expectations already incorporated into its price.
Sometimes a stock rises before an anticipated announcement but declines after the company reports favorable results. This market behavior is commonly described as “buy the rumor, sell the news.” A company may also report strong historical results while providing guidance below market expectations, which can lead to a negative price reaction.
For educational analysis, examining earnings trends across several quarters can provide more context than focusing only on a company’s results or stock-price reaction from a single reporting period.
This article is for general informational and educational purposes only. It is not intended as financial advice, investment guidance, or a recommendation to buy or sell any security. The content reflects publicly available information and broad market commentary. Readers should conduct their own research and consult a licensed financial professional before making investment decisions.
Source: Mark & Zacks Investment Research Inc.
Leave a Reply