Any stock market investor who has been in it for a few years or more knows they have experienced volatility and plenty of ups and downs. They endure all this uncertainty because they expect the markets to increase over time, and historically, this expectation has been largely accurate.
Even for experienced investors, market corrections can be scary because you can’t know how far the market will fall or how long it will take to rebound. It’s essential to remember that recoveries (bull markets) following corrections tend to be strong and last significantly longer.
About This Page
Stockmark101.com is a free educational site focused on explaining how stocks and markets work. Company write-ups reflect general market commentary and publicly available information and are used to illustrate business fundamentals and market behavior — not personalized investment advice.
Causes of Downturns
Market corrections don’t come out of nowhere; they’re often sparked by political uncertainty, economic shifts, or global crises, such as war. When investors are spooked by reports of a slowing economy or other news relevant to their investments, they’re more likely to sell their stocks than buy new ones, which drives down the market.
Federal Reserve interest rate changes can also contribute to a market falling into correction territory. When interest rates rise to combat inflation, borrowing becomes more expensive. As a result, the economy cools, which triggers sell-offs.
While stock market corrections can make investors uneasy, they’re technically a normal and healthy part of the market’s cycle. After all, what goes up must come down. Sometimes, stock prices get too high, too quickly, and a correction is just the market’s way of leveling things out. It helps restore balance in the markets and bring prices back to their typical levels.
Definitions
Pullpack or Dip: A decline of less than 10%.
Correction: A drop of more than 10% but less than 20%.
Crash: A decline of 20% or more.
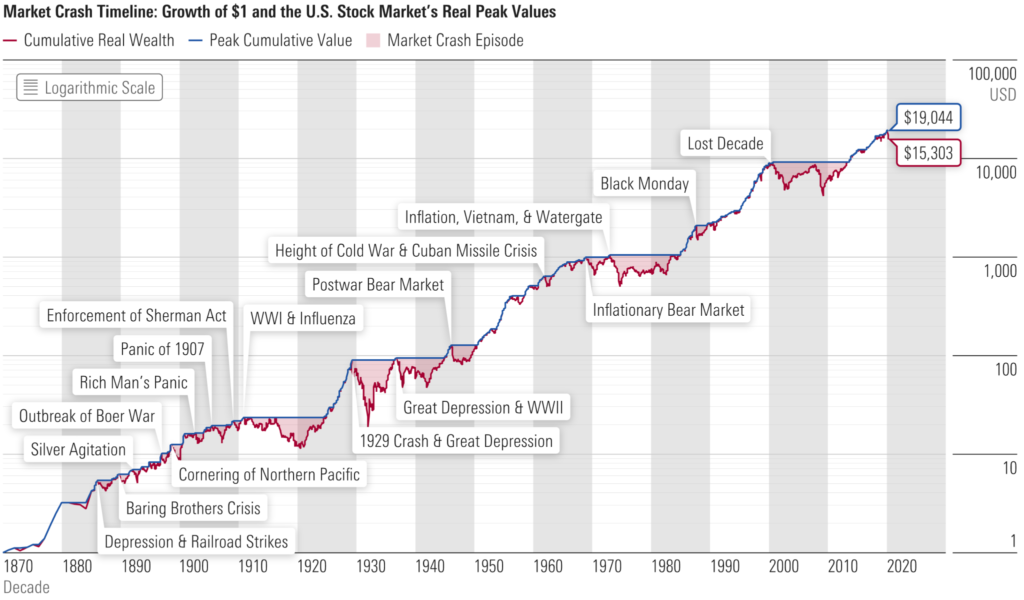
Crashes
Since 1950, the stock market has declined 20% or more on 13 occasions. The average decline is 32.73%, and the average length of the market crash is 338 days.
Corrections
There have been 25 stock market corrections since World War II, and the average correction sees the market drop 14.3%. The latest decline in 2025 was a 10% drop after the liberation day tariff announcement. Media headlines sometimes play up stock market corrections as “crashes” to grab the attention of readers.
A stock market is considered to have left correction territory once it starts hitting new highs after a period of decline. Market corrections are usually short-lived, lasting anywhere from a few weeks to a few months, and are often followed by strong rebounds. Of course, it’s also possible they continue their downward trend and develop into a bear market, which takes longer to recover from.
Looking at S&P 500 data, the market tends to bounce back relatively quickly after a decline. On average, it takes about three months to recover from a smaller dip of 5% to 10%, and around eight months to recover from a more significant stock market correction. But if a recession occurs, the market can decline further and may take years to fully recover.
Mark Notes
History never repeats itself, but it often rhymes. When the stock market declines, the media jumps on the story with click-worthy headlines. In the past, experienced and successful investors didn’t react emotionally, didn’t panic, didn’t try to time the market, and stayed invested. Selling stocks when the market is down and going to cash will lock in a capital loss that cannot be undone when the market recovers.
Historically, when the market is rising, investors feel confident and often take chances on lower-quality stocks that may offer higher returns. These stocks are more exposed and tend to decline further than quality stocks during a correction. Selling low-quality stocks and buying higher-quality stocks that are also down during a correction has proven a wise strategy in the past.
New to investing? These explanations may help:
Growth vs. Value: Why Some Stocks Move So Differently
This article is for general informational and educational purposes only. It is not intended as financial advice, investment guidance, or a recommendation to buy or sell any security. The content reflects publicly available information and broad market commentary. Readers should conduct their own research and consult a licensed financial professional before making investment decisions.
Leave a Reply